Results of the 41st Canadian federal election
2011 Canadian federal election Turnout 61.1% Party Leader % Seats +/– Conservative Stephen Harper 39.6% 166 +23 New Democratic Jack Layton 30.6% 103 +67 Liberal Michael Ignatieff 18.9% 34 −43 Bloc Québécois Gilles Duceppe 6.0% 4 −43 Green Elizabeth May 3.9% 1 +1
This lists parties that won seats. See the complete results below.
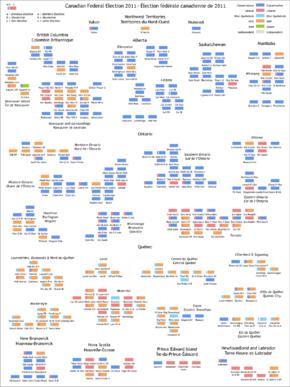
Analysis of results by riding, together with comparisons from previous election and at dissolution.
The 41st Canadian federal election was held on May 2, 2011. It resulted in a Conservative majority government under the leadership of Prime Minister Stephen Harper .[ 1] Progressive Conservatives won their last majority in 1988.[ 2] [ 1] House of Commons .[ 3]
The election resulted in significant upheaval within the opposition parties, as the New Democratic Party (NDP) rode an "orange surge" in the polls during the campaign to 103 seats, becoming Her Majesty's Loyal Opposition for the first time in party history.[ 4] [ 5] [ 6] [ 7] Green Party leader Elizabeth May won in her riding, becoming the first Green Party candidate elected to a governmental body in Canada, and to a national body in North America.[ 8]
Following their staggering defeats, including losing their own seats, Bloc Québécois leader Gilles Duceppe and Liberal leader Michael Ignatieff both announced their resignations as party leaders.[ 6] [ 9]
Vote total [citation needed
Rendition of party representation in the 41st Canadian Parliament decided by this election. Conservatives (166)
New Democrats (103)
Liberals (34)
Bloc Québécois (4)
Green Party (1)
National Results (Preliminary) Party Seats Votes % +/- Conservative 166 5,832,560 39.62 +1.97 New Democratic 103 4,508,474 30.63 +12.44 Liberal 34 2,783,175 18.91 -7.36 Bloc Québécois 4 889,788 6.04 -3.93 Green 1 576,221 3.91 -2.86 Independent 0 63,340 0.43 -0.22 Christian Heritage 0 19,218 0.131 -0.061 Marxist–Leninist 0 10,160 0.069 +0.007 No affiliation 0 9,391 0.064 +0.024 Libertarian 0 6,017 0.041 -0.012 Progressive Canadian 0 5,838 0.040 -0.003 Rhinoceros 0 3,819 0.026 +0.011 Pirate 0 3,198 0.022 * Communist 0 2,925 0.020 -0.006 Canadian Action 0 2,030 0.0138 -0.0112 Marijuana 0 1,864 0.0127 -0.0039 Animal Alliance 0 1,451 0.0099 +0.0060 Western Block 0 748 0.0051 +0.0037 United 0 294 0.0020 * First Peoples National 0 228 0.00155 -0.01010 Total 308 14,720,580 100.00
Popular support based on winning and losing candidates Party Winners Votes Party % Total % Losers Votes Party % Total % Conservative 166 4,380,401 74.91% 58.98% 141 1,467,337 25.09% 20.11% New Democratic 103 2,378,632 52.49% 32.03% 205 2,153,097 47.51% 29.50% Liberal 34 571,379 20.52% 7.69% 274 2,213,095 79.48% 30.33% Bloc Québécois 4 64,620 7.25% 0.87% 71 826,809 92.75% 11.33% Green 1 31,890 5.56% 0.43% 303 541,318 94.44% 7.42% Other 0 0 0.00% 0.00% 285 95,790 100.00% 1.31% Totals 308 7,426,922 50.44% 100.00% 1,279 7,297,446 49.56% 100.00%
Synopsis of results Results by riding - 2011 Canadian federal election[ a 1] Prov/ Riding 2008 Winning party Turnout[ a 2] Votes[ a 3] Party Party Votes Share Margin Margin Con NDP Lib BQ Green Ind Other Total[ a 4] AB Calgary Centre-North Con Con 28,443 56.53% 20,395 40.53% 59.71% 28,443 8,048 7,046 – 6,578 – 203 50,318 AB Calgary Centre Con Con 28,401 57.68% 19,770 40.15% 55.28% 28,401 7,314 8,631 – 4,889 – – 49,235 AB Calgary East Con Con 23,372 67.43% 18,478 53.31% 45.94% 23,372 4,894 4,102 – 2,047 – 246 34,661 AB Calgary Northeast Con Con 23,550 56.80% 12,063 29.10% 47.80% 23,550 4,262 11,487 – 1,953 – 206 41,458 AB Calgary Southeast Con Con 48,173 76.26% 41,691 66.00% 59.47% 48,173 6,482 4,020 – 4,079 225 193 63,172 AB Calgary Southwest Con Con 42,998 75.12% 36,175 63.20% 60.42% 42,998 6,823 4,121 – 2,991 303 – 57,236 AB Calgary West Con Con 39,996 62.16% 28,622 44.48% 62.31% 39,996 6,679 11,374 – 6,070 – 227 64,346 AB Calgary—Nose Hill Con Con 40,384 70.17% 33,195 57.68% 56.64% 40,384 7,189 6,501 – 3,480 – – 57,554 AB Crowfoot Con Con 44,115 83.99% 39,310 74.84% 59.24% 44,115 4,805 1,224 – 1,711 463 204 52,522 AB Edmonton Centre Con Con 23,625 48.03% 11,145 22.66% 57.16% 23,625 12,480 11,037 – 1,676 – 370 49,188 AB Edmonton East Con Con 24,111 52.75% 7,033 15.39% 49.62% 24,111 17,078 3,176 – 1,345 – – 45,710 AB Edmonton—Leduc Con Con 37,778 63.57% 26,290 44.24% 58.68% 37,778 11,488 7,270 – 2,896 – – 59,432 AB Edmonton—Mill Woods—Beaumont Con Con 27,857 61.04% 16,982 37.21% 52.96% 27,857 10,875 5,066 – 1,364 – 474 45,636 AB Edmonton—Sherwood Park Con Con 24,623 44.66% 8,360 15.16% 58.44% 24,623 7,971 4,131 – 1,926 16,263 222 55,136 AB Edmonton—Spruce Grove Con Con 41,782 71.10% 32,510 55.32% 55.79% 41,782 9,272 5,483 – 2,232 – – 58,769 AB Edmonton—St. Albert Con Con 34,468 63.46% 22,824 42.02% 55.86% 34,468 11,644 5,796 – 2,409 – – 54,317 AB Edmonton—Strathcona NDP NDP 26,093 53.55% 6,331 12.99% 66.52% 19,762 26,093 1,372 – 1,119 293 91 48,730 AB Fort McMurray—Athabasca Con Con 21,988 71.84% 17,935 58.60% 40.30% 21,988 4,053 3,190 – 1,374 – – 30,605 AB Lethbridge Con Con 27,173 56.51% 14,101 29.32% 53.75% 27,173 13,072 4,030 – 2,095 – 1,716 48,086 AB Macleod Con Con 40,007 77.48% 34,672 67.15% 60.42% 40,007 5,335 1,898 – 2,389 – 2,006 51,635 AB Medicine Hat Con Con 30,719 71.55% 25,103 58.47% 52.13% 30,719 5,616 4,416 – 1,868 – 317 42,936 AB Peace River Con Con 36,334 75.76% 28,594 59.62% 49.00% 36,334 7,740 1,481 – 1,702 359 345 47,961 AB Red Deer Con Con 37,959 75.93% 30,393 60.79% 53.47% 37,959 7,566 1,918 – 2,551 – – 49,994 AB Vegreville—Wainwright Con Con 39,145 79.79% 33,584 68.46% 58.67% 39,145 5,561 1,525 – 2,499 – 327 49,057 AB Westlock—St. Paul Con Con 32,652 77.82% 27,549 65.66% 55.21% 32,652 5,103 2,569 – 1,634 – – 41,958 AB Wetaskiwin Con Con 37,756 81.44% 32,475 70.05% 57.92% 37,756 5,281 1,348 – 1,978 – – 46,363 AB Wild Rose Con Con 43,669 74.74% 37,074 63.46% 61.23% 43,669 6,595 3,908 – 4,071 – 181 58,424 AB Yellowhead Con Con 31,925 77.03% 26,514 63.97% 55.13% 31,925 5,411 1,190 – 2,132 – 788 41,446 BC Abbotsford Con Con 32,493 65.02% 22,404 44.83% 58.96% 32,493 10,089 4,968 – 2,138 – 286 49,974 BC British Columbia Southern Interior NDP NDP 25,206 50.92% 5,933 11.98% 65.58% 19,273 25,206 1,872 – 3,153 – – 49,504 BC Burnaby—Douglas NDP NDP 20,943 43.00% 1,011 2.08% 57.63% 19,932 20,943 5,451 – 1,754 – 630 48,710 BC Burnaby—New Westminster NDP NDP 22,193 49.67% 6,184 13.84% 53.25% 16,009 22,193 4,496 – 1,731 – 254 44,683 BC Cariboo—Prince George Con Con 24,443 56.17% 11,308 25.98% 57.32% 24,443 13,135 2,200 – 2,702 394 644 43,518 BC Chilliwack—Fraser Canyon Con Con 28,160 57.20% 15,469 31.42% 58.14% 28,160 12,691 5,320 – 2,706 – 353 49,230 BC Delta—Richmond East Con Con 26,059 54.24% 14,878 30.97% 59.65% 26,059 11,181 8,112 – 2,324 220 147 48,043 BC Esquimalt—Juan de Fuca Lib NDP 26,198 40.87% 406 0.63% 65.24% 25,792 26,198 6,439 – 5,341 181 145 64,096 BC Fleetwood—Port Kells Con Con 23,950 47.55% 7,417 14.73% 52.86% 23,950 16,533 8,041 – 1,476 – 370 50,370 BC Kamloops—Thompson—Cariboo Con Con 29,682 52.24% 8,699 15.31% 62.71% 29,682 20,983 3,026 – 2,932 – 191 56,814 BC Kelowna—Lake Country Con Con 34,566 57.40% 21,244 35.28% 59.84% 34,566 13,322 7,069 – 5,265 – – 60,222 BC Kootenay—Columbia Con Con 23,910 55.88% 9,711 22.70% 63.45% 23,910 14,199 1,496 – 2,547 636 – 42,788 BC Langley Con Con 35,569 64.52% 24,292 44.06% 61.28% 35,569 11,277 4,990 – 2,943 – 353 55,132 BC Nanaimo—Alberni Con Con 30,469 46.42% 5,304 8.08% 66.70% 30,469 25,165 4,984 – 4,482 – 538 65,638 BC Nanaimo—Cowichan NDP NDP 31,272 48.90% 6,775 10.59% 64.20% 24,497 31,272 3,007 – 5,005 – 170 63,951 BC New Westminster—Coquitlam NDP NDP 23,023 45.93% 2,247 4.48% 59.61% 20,776 23,023 4,069 – 2,160 – 95 50,123 BC Newton—North Delta Lib NDP 15,413 33.42% 903 1.96% 61.45% 14,437 15,413 14,510 – 1,520 123 116 46,119 BC North Vancouver Con Con 28,996 48.62% 11,331 19.00% 66.86% 28,996 9,617 17,665 – 3,004 350 – 59,632 BC Okanagan—Coquihalla Con Con 28,525 53.58% 15,672 29.44% 61.90% 28,525 12,853 5,815 – 5,005 1,040 – 53,238 BC Okanagan—Shuswap Con Con 31,439 55.45% 16,484 29.07% 61.94% 31,439 14,955 4,246 – 6,058 – – 56,698 BC Pitt Meadows—Maple Ridge—Mission Con Con 28,803 54.34% 9,968 18.81% 59.33% 28,803 18,835 2,739 – 2,629 – – 53,006 BC Port Moody—Westwood—Port Coquitlam Con Con 27,181 56.07% 12,581 25.95% 56.46% 27,181 14,600 4,110 – 2,161 – 421 48,473 BC Prince George—Peace River Con Con 23,946 62.12% 14,070 36.50% 53.28% 23,946 9,876 2,008 – 2,301 – 415 38,546 BC Richmond Con Con 25,109 58.36% 17,082 39.70% 50.50% 25,109 7,860 8,027 – 2,032 – – 43,028 BC Saanich—Gulf Islands Con Grn 31,890 46.33% 7,346 10.67% 73.88% 24,544 8,185 4,208 – 31,890 – – 68,827 BC Skeena—Bulkley Valley NDP NDP 19,431 55.33% 7,314 20.83% 57.72% 12,117 19,431 1,268 – 1,102 – 1,203 35,121 BC South Surrey—White Rock—Cloverdale Con Con 31,990 54.55% 20,109 34.29% 64.27% 31,990 11,881 9,775 – 3,245 1,094 657 58,642 BC Surrey North Con NDP 14,678 39.69% 1,497 4.05% 51.63% 13,181 14,678 6,797 – 1,289 451 587 36,983 BC Vancouver Centre Lib Lib 18,260 31.03% 2,935 4.99% 57.71% 15,323 15,325 18,260 – 9,089 – 852 58,849 BC Vancouver East NDP NDP 27,794 62.83% 19,433 43.93% 54.42% 8,361 27,794 4,382 – 3,383 – 318 44,238 BC Vancouver Island North Con Con 27,206 46.11% 1,827 3.10% 65.49% 27,206 25,379 3,039 – 3,018 304 57 59,003 BC Vancouver Kingsway NDP NDP 23,452 50.08% 10,295 21.98% 57.06% 13,157 23,452 7,796 – 1,860 – 563 46,828 BC Vancouver Quadra Lib Lib 22,903 42.17% 1,919 3.53% 62.43% 20,984 7,499 22,903 – 2,922 – – 54,308 BC Vancouver South Lib Con 19,504 43.31% 3,900 8.66% 54.92% 19,504 8,552 15,604 – 1,151 – 222 45,033 BC Victoria NDP NDP 30,679 50.78% 16,404 27.15% 67.55% 14,275 30,679 8,448 – 7,015 – – 60,417 BC West Vancouver—Sunshine Coast—Sea to Sky Country Con Con 28,614 45.53% 13,786 21.93% 63.30% 28,614 14,828 14,123 – 4,436 – 850 62,851 MB Brandon—Souris Con Con 22,386 63.73% 13,541 38.55% 57.54% 22,386 8,845 1,882 – 2,012 – – 35,125 MB Charleswood—St. James—Assiniboia Con Con 23,264 57.56% 15,130 37.43% 64.77% 23,264 8,134 7,433 – 1,587 – – 40,418 MB Churchill NDP NDP 10,262 51.12% 5,006 24.94% 43.81% 5,256 10,262 4,087 – 471 – – 20,076 MB Dauphin—Swan River—Marquette Con Con 18,543 63.09% 10,886 37.04% 54.90% 18,543 7,657 1,947 – 1,243 – – 29,390 MB Elmwood—Transcona NDP Con 15,298 46.40% 300 0.91% 55.93% 15,298 14,998 1,660 – 1,017 – – 32,973 MB Kildonan—St. Paul Con Con 22,670 58.16% 10,943 28.07% 61.27% 22,670 11,727 3,199 – 1,020 363 – 38,979 MB Portage—Lisgar Con Con 26,899 75.99% 23,421 66.16% 59.44% 26,899 3,478 2,221 – 1,996 – 805 35,399 MB Provencher Con Con 27,820 70.60% 20,769 52.71% 61.73% 27,820 7,051 2,645 – 1,164 – 725 39,405 MB Saint Boniface Con Con 21,737 50.28% 8,423 19.48% 66.17% 21,737 6,935 13,314 – 1,245 – – 43,231 MB Selkirk—Interlake Con Con 26,848 65.19% 15,915 38.64% 62.29% 26,848 10,933 1,980 – 1,423 – – 41,184 MB Winnipeg Centre NDP NDP 13,928 53.66% 6,755 26.03% 48.20% 7,173 13,928 2,872 – 1,830 – 152 25,955 MB Winnipeg North NDP Lib 9,097 35.78% 44 0.17% 49.26% 6,701 9,053 9,097 – 458 – 118 25,427 MB Winnipeg South Con Con 22,840 52.24% 8,544 19.54% 68.45% 22,840 5,693 14,296 – 889 – – 43,718 MB Winnipeg South Centre Lib Con 15,506 38.82% 722 1.81% 69.04% 15,506 7,945 14,784 – 1,383 321 – 39,939 NB Acadie—Bathurst NDP NDP 32,067 69.69% 24,611 53.49% 70.30% 7,456 32,067 6,491 – – – – 46,014 NB Beauséjour Lib Lib 17,399 39.08% 2,588 5.81% 71.21% 14,811 10,397 17,399 – 1,913 – – 44,520 NB Fredericton Con Con 21,573 48.38% 10,947 24.55% 64.24% 21,573 10,626 10,336 – 1,790 266 – 44,591 NB Fundy Royal Con Con 21,206 58.14% 11,361 31.15% 64.64% 21,206 9,845 3,668 – 1,757 – – 36,476 NB Madawaska—Restigouche Lib Con 14,224 40.64% 1,915 5.47% 69.80% 14,224 6,562 12,309 – 612 1,290 – 34,997 NB Miramichi Con Con 16,112 52.41% 9,015 29.32% 71.40% 16,112 7,097 6,800 – 735 – – 30,744 NB Moncton—Riverview—Dieppe Lib Con 17,408 35.73% 2,161 4.44% 65.17% 17,408 14,053 15,247 – 2,016 – – 48,724 NB New Brunswick Southwest Con Con 18,066 56.64% 10,653 33.40% 64.71% 18,066 7,413 4,320 – 1,646 – 450 31,895 NB Saint John Con Con 18,456 49.73% 7,074 19.06% 58.02% 18,456 11,382 5,964 – 1,017 294 – 37,113 NB Tobique—Mactaquac Con Con 21,108 62.70% 14,720 43.73% 63.91% 21,108 6,388 5,337 – 831 – – 33,664 NL Avalon Lib Lib 16,008 43.97% 1,259 3.46% 56.77% 14,749 5,157 16,008 – 218 276 – 36,408 NL Bonavista—Gander—Grand Falls—Windsor Lib Lib 17,977 57.70% 9,382 30.11% 44.77% 8,595 4,306 17,977 – 279 – – 31,157 NL Humber—St. Barbe—Baie Verte Lib Lib 17,119 57.04% 9,560 31.85% 50.94% 7,559 4,751 17,119 – 253 332 – 30,014 NL Labrador Lib Con 4,256 39.81% 79 0.74% 52.91% 4,256 2,120 4,177 – 139 – – 10,692 NL Random—Burin—St. George's Lib Lib 12,914 49.65% 4,592 17.66% 45.40% 8,322 4,465 12,914 – 307 – – 26,008 NL St. John's East NDP NDP 31,388 71.22% 22,190 50.35% 57.85% 9,198 31,388 3,019 – 467 – – 44,072 NL St. John's South—Mount Pearl Lib NDP 18,681 47.92% 7,551 19.37% 58.33% 8,883 18,681 11,130 – 291 – – 38,985 NS Cape Breton—Canso Lib Lib 16,478 46.45% 5,605 15.80% 62.47% 10,873 6,984 16,478 – 1,141 – – 35,476 NS Central Nova Con Con 21,593 56.79% 12,181 32.03% 65.99% 21,593 9,412 5,614 – 1,406 – – 38,025 NS Cumberland—Colchester—Musquodoboit Valley Ind Con 21,041 52.46% 11,719 29.22% 58.34% 21,041 9,322 7,264 – 2,109 – 375 40,111 NS Dartmouth—Cole Harbour Lib NDP 15,678 36.27% 497 1.15% 61.45% 10,702 15,678 15,181 – 1,662 – – 43,223 NS Halifax NDP NDP 23,746 51.64% 11,953 25.99% 63.02% 8,276 23,746 11,793 – 2,020 – 152 45,987 NS Halifax West Lib Lib 16,230 35.92% 2,448 5.42% 62.34% 13,782 13,239 16,230 – 1,931 – – 45,182 NS Kings—Hants Lib Lib 15,887 39.56% 1,173 2.92% 61.76% 14,714 8,043 15,887 – 1,520 – – 40,164 NS Sackville—Eastern Shore NDP NDP 22,483 54.07% 9,821 23.62% 59.47% 12,662 22,483 4,673 – 1,762 – – 41,580 NS South Shore—St. Margaret's Con Con 17,948 43.15% 2,915 7.01% 62.23% 17,948 15,033 7,037 – 1,579 – – 41,597 NS Sydney—Victoria Lib Lib 14,788 39.91% 765 2.06% 61.48% 14,023 7,049 14,788 – 1,191 – – 37,051 NS West Nova Con Con 20,204 47.04% 4,572 10.64% 63.75% 20,204 5,631 15,632 – 1,487 – – 42,954 ON Ajax—Pickering Lib Con 24,797 44.07% 3,228 5.74% 60.34% 24,797 8,270 21,569 – 1,561 – 71 56,268 ON Algoma—Manitoulin—Kapuskasing NDP NDP 18,747 51.73% 7,756 21.40% 61.88% 10,991 18,747 5,374 – 1,130 – – 36,242 ON Ancaster—Dundas—Flamborough—Westdale Con Con 30,240 51.25% 15,646 26.52% 68.52% 30,240 10,956 14,594 – 2,963 – 247 59,000 ON Barrie Con Con 32,121 56.70% 20,279 35.80% 59.85% 32,121 11,842 9,113 – 3,266 – 309 56,651 ON Beaches—East York Lib NDP 20,265 41.64% 5,298 10.89% 66.66% 11,067 20,265 14,967 – 2,240 – 130 48,669 ON Bramalea—Gore—Malton Lib Con 19,907 34.44% 539 0.93% 53.56% 19,907 19,368 16,402 – 1,748 – 371 57,796 ON Brampton West Lib Con 28,320 44.75% 6,192 9.78% 54.00% 28,320 11,225 22,128 – 1,224 387 – 63,284 ON Brampton—Springdale Lib Con 24,618 48.26% 10,397 20.38% 57.71% 24,618 10,022 14,221 – 1,926 – 219 51,006 ON Brant Con Con 28,045 48.90% 11,694 20.39% 60.30% 28,045 16,351 10,780 – 1,858 312 – 57,346 ON Bruce—Grey—Owen Sound Con Con 28,744 56.30% 19,736 38.66% 64.12% 28,744 9,008 8,203 – 5,099 – – 51,054 ON Burlington Con Con 32,958 54.16% 18,804 30.90% 66.54% 32,958 11,449 14,154 – 2,151 – 140 60,852 ON Cambridge Con Con 29,394 53.40% 14,156 25.72% 58.47% 29,394 15,238 8,285 – 1,978 – 153 55,048 ON Carleton—Mississippi Mills Con Con 43,723 56.95% 25,330 32.99% 71.66% 43,723 11,223 18,393 – 3,434 – – 76,773 ON Chatham-Kent—Essex Con Con 23,360 53.76% 11,911 27.41% 58.83% 23,360 11,449 7,172 – 1,470 – – 43,451 ON Davenport Lib NDP 21,096 53.74% 10,150 25.86% 59.18% 5,573 21,096 10,946 – 1,344 – 295 39,254 ON Don Valley East Lib Con 14,422 36.78% 870 2.22% 56.58% 14,422 9,878 13,552 – 1,114 – 246 39,212 ON Don Valley West Lib Con 22,962 42.93% 611 1.14% 65.35% 22,962 6,280 22,351 – 1,703 – 186 53,482 ON Dufferin—Caledon Con Con 28,647 59.01% 21,515 44.32% 60.05% 28,647 6,409 6,361 – 7,132 – – 48,549 ON Durham Con Con 31,737 54.55% 19,460 33.45% 63.21% 31,737 12,277 10,387 – 3,134 – 649 58,184 ON Eglinton—Lawrence Lib Con 22,652 46.81% 4,062 8.39% 66.23% 22,652 5,613 18,590 – 1,534 – – 48,389 ON Elgin—Middlesex—London Con Con 29,147 57.55% 16,708 32.99% 62.23% 29,147 12,439 6,812 – 1,529 – 722 50,649 ON Essex Con Con 25,327 48.06% 6,789 12.88% 58.54% 25,327 18,538 7,465 – 1,290 – 77 52,697 ON Etobicoke Centre Lib Con 21,644 41.21% 26 0.05% 64.57% 21,644 7,735 21,618 – 1,377 – 149 52,523 ON Etobicoke North Lib Lib 13,665 42.39% 3,308 10.26% 51.60% 10,357 7,630 13,665 – – – 583 32,235 ON Etobicoke—Lakeshore Lib Con 21,997 40.35% 2,869 5.26% 62.81% 21,997 11,046 19,128 – 2,159 – 190 54,520 ON Glengarry—Prescott—Russell Con Con 28,174 48.80% 10,469 18.13% 67.95% 28,174 9,608 17,705 – 2,049 – 194 57,730 ON Guelph Lib Lib 25,588 43.35% 6,236 10.57% 64.92% 19,352 9,880 25,588 – 3,619 – 582 59,021 ON Haldimand—Norfolk Con Con 25,655 50.94% 13,106 26.02% 62.78% 25,655 10,062 12,549 – 1,665 – 435 50,366 ON Haliburton—Kawartha Lakes—Brock Con Con 35,192 60.03% 22,258 37.96% 63.05% 35,192 12,934 7,539 – 2,963 – – 58,628 ON Halton Con Con 44,214 54.52% 23,311 28.74% 61.70% 44,214 12,960 20,903 – 2,778 – 249 81,104 ON Hamilton Centre NDP NDP 23,849 57.04% 12,829 30.68% 53.63% 11,020 23,849 5,912 – – – 1,032 41,813 ON Hamilton East—Stoney Creek NDP NDP 21,931 45.18% 4,364 8.99% 57.06% 17,567 21,931 6,411 – 1,450 – 1,178 48,537 ON Hamilton Mountain NDP NDP 25,595 47.17% 7,659 14.11% 61.05% 17,936 25,595 8,787 – 1,505 171 270 54,264 ON Huron—Bruce Con Con 29,255 54.95% 15,762 29.61% 67.97% 29,255 13,493 8,784 – 1,455 254 – 53,241 ON Kenora Con Con 11,567 47.05% 4,712 19.17% 58.77% 11,567 6,855 5,381 – 636 147 – 24,586 ON Kingston and the Islands Lib Lib 23,842 39.31% 2,653 4.37% 63.38% 21,189 13,065 23,842 – 2,561 – – 60,657 ON Kitchener Centre Con Con 21,119 42.40% 5,527 11.10% 62.15% 21,119 10,742 15,592 – 1,972 199 185 49,809 ON Kitchener—Conestoga Con Con 28,902 54.12% 17,237 32.28% 60.36% 28,902 11,665 10,653 – 2,184 – – 53,404 ON Kitchener—Waterloo Con Con 27,039 40.85% 2,144 3.24% 69.19% 27,039 10,606 24,895 – 3,158 174 311 66,183 ON Lambton—Kent—Middlesex Con Con 29,546 57.68% 17,247 33.67% 64.51% 29,546 12,299 7,264 – 1,701 – 413 51,223 ON Lanark—Frontenac—Lennox and Addington Con Con 33,754 57.27% 21,580 36.61% 64.63% 33,754 12,174 9,940 – 2,702 370 – 58,940 ON Leeds—Grenville Con Con 29,991 60.81% 20,958 42.49% 64.42% 29,991 9,033 7,839 – 2,460 – – 49,323 ON London North Centre Lib Con 19,468 36.96% 1,665 3.16% 59.79% 19,468 12,996 17,803 – 2,177 – 229 52,673 ON London West Con Con 27,675 44.49% 11,023 17.72% 66.53% 27,675 16,109 16,652 – 1,703 – 65 62,204 ON London—Fanshawe NDP NDP 21,689 50.90% 7,395 17.35% 57.03% 14,294 21,689 4,893 – 1,202 – 535 42,613 ON Markham—Unionville Lib Lib 19,429 38.95% 1,695 3.40% 54.17% 17,734 10,897 19,429 – 1,597 – 231 49,888 ON Mississauga East—Cooksville Lib Con 18,796 39.97% 676 1.44% 55.65% 18,796 8,836 18,120 – 1,032 – 241 47,025 ON Mississauga South Lib Con 22,991 46.48% 4,598 9.30% 63.21% 22,991 6,354 18,393 – 1,532 194 – 49,464 ON Mississauga—Brampton South Lib Con 23,632 44.72% 5,053 9.56% 56.28% 23,632 9,465 18,579 – 1,044 – 127 52,847 ON Mississauga—Erindale Con Con 29,793 46.95% 8,252 13.00% 60.39% 29,793 10,327 21,541 – 1,694 – 99 63,454 ON Mississauga—Streetsville Lib Con 22,104 43.86% 3,453 6.85% 57.85% 22,104 7,834 18,651 – 1,802 – – 50,391 ON Nepean—Carleton Con Con 43,477 54.45% 23,331 29.22% 71.19% 43,477 12,962 20,146 – 3,260 – – 79,845 ON Newmarket—Aurora Con Con 31,600 54.29% 17,692 30.40% 63.00% 31,600 8,886 13,908 – 2,628 – 1,180 58,202 ON Niagara Falls Con Con 28,748 53.26% 16,067 29.76% 56.40% 28,748 12,681 10,206 – 2,086 – 259 53,980 ON Niagara West—Glanbrook Con Con 33,701 57.25% 20,967 35.62% 65.79% 33,701 12,734 8,699 – 2,530 – 1,199 58,863 ON Nickel Belt NDP NDP 24,566 54.97% 12,063 26.99% 62.06% 12,503 24,566 6,308 – 1,252 – 59 44,688 ON Nipissing—Timiskaming Lib Con 15,495 36.66% 18 0.04% 60.06% 15,495 8,781 15,477 – 2,518 – – 42,271 ON Northumberland—Quinte West Con Con 32,853 53.83% 20,031 32.82% 63.67% 32,853 12,626 12,822 – 2,733 – – 61,034 ON Oak Ridges—Markham Con Con 46,241 51.12% 20,680 22.86% 59.03% 46,241 15,229 25,561 – 2,349 – 1,080 90,460 ON Oakville Con Con 30,068 51.65% 12,178 20.92% 67.98% 30,068 8,117 17,890 – 2,140 – – 58,215 ON Oshawa Con Con 26,034 51.31% 6,822 13.45% 56.82% 26,034 19,212 3,536 – 1,631 – 321 50,734 ON Ottawa Centre NDP NDP 33,805 52.11% 19,742 30.43% 72.37% 14,063 33,805 13,049 – 3,262 210 479 64,868 ON Ottawa South Lib Lib 25,963 44.01% 6,329 10.73% 67.82% 19,634 10,712 25,963 – 1,787 – 895 58,991 ON Ottawa West—Nepean Con Con 25,226 44.71% 7,436 13.18% 68.44% 25,226 11,128 17,790 – 2,279 – – 56,423 ON Ottawa—Vanier Lib Lib 20,009 38.17% 4,618 8.81% 71.71% 14,184 15,391 20,009 – 2,716 – 122 52,422 ON Ottawa—Orléans Con Con 28,584 44.55% 3,935 6.13% 66.50% 28,584 9,086 24,649 – 1,839 – – 64,158 ON Oxford Con Con 27,973 58.90% 15,809 33.29% 61.88% 27,973 12,164 4,521 – 2,058 – 776 47,492 ON Parkdale—High Park Lib NDP 24,046 47.20% 7,289 14.31% 68.71% 7,924 24,046 16,757 – 1,666 – 552 50,945 ON Parry Sound-Muskoka Con Con 25,864 55.73% 14,647 31.56% 65.11% 25,864 11,217 5,330 – 3,776 168 54 46,409 ON Perth Wellington Con Con 25,281 54.48% 15,420 33.23% 63.47% 25,281 9,861 8,341 – 2,112 – 806 46,401 ON Peterborough Con Con 29,393 49.67% 14,670 24.79% 64.71% 29,393 14,723 12,664 – 2,105 189 104 59,178 ON Pickering—Scarborough East Lib Con 19,220 40.11% 1,207 2.52% 61.24% 19,220 8,932 18,013 – 1,751 – – 47,916 ON Prince Edward—Hastings Con Con 29,062 53.25% 16,122 29.54% 61.40% 29,062 12,940 10,230 – 1,887 283 171 54,573 ON Renfrew—Nipissing—Pembroke Con Con 27,462 53.43% 17,851 34.73% 65.85% 27,462 6,903 6,545 – 877 9,611 – 51,398 ON Richmond Hill Lib Con 22,078 44.14% 4,407 8.81% 55.25% 22,078 8,433 17,671 – 1,832 – – 50,014 ON Sarnia—Lambton Con Con 26,112 52.58% 11,256 22.66% 62.58% 26,112 14,856 6,931 – 1,252 – 514 49,665 ON Sault Ste. Marie NDP Con 18,328 41.44% 1,861 4.21% 64.19% 18,328 16,467 8,343 – 945 – 149 44,232 ON Scarborough Centre Lib Con 13,498 35.55% 1,470 3.87% 54.34% 13,498 11,443 12,028 – 998 – – 37,967 ON Scarborough Southwest Lib NDP 14,119 35.05% 1,289 3.20% 58.37% 12,830 14,119 11,699 – 1,635 – – 40,283 ON Scarborough—Agincourt Lib Lib 18,498 45.39% 4,568 11.21% 56.03% 13,930 7,376 18,498 – 946 – – 40,750 ON Scarborough-Guildwood Lib Lib 13,849 36.20% 691 1.81% 56.76% 13,158 10,145 13,849 – 848 259 – 38,259 ON Scarborough—Rouge River Lib NDP 18,935 40.62% 5,000 10.73% 54.98% 13,935 18,935 12,699 – 684 357 – 46,610 ON Simcoe North Con Con 31,581 54.45% 20,066 34.60% 64.07% 31,581 11,515 11,090 – 3,489 – 322 57,997 ON Simcoe—Grey Con Con 31,784 49.37% 20,599 32.00% 65.06% 31,784 11,185 8,207 – 3,482 8,714 1,001 64,373 ON St. Catharines Con Con 25,571 50.86% 13,598 27.05% 60.50% 25,571 11,973 10,358 – 1,924 – 448 50,274 ON St. Paul's Lib Lib 22,409 40.60% 4,545 8.23% 66.54% 17,864 12,124 22,409 – 2,495 – 303 55,195 ON Stormont—Dundas—South Glengarry Con Con 29,538 62.12% 21,028 44.22% 62.09% 29,538 8,313 8,510 – 1,038 – 151 47,550 ON Sudbury NDP NDP 22,684 49.92% 9,803 21.57% 63.35% 12,881 22,684 8,172 – 1,359 116 229 45,441 ON Thornhill Con Con 36,629 61.38% 22,504 37.71% 60.03% 36,629 7,141 14,125 – 1,562 – 215 59,672 ON Thunder Bay—Rainy River NDP NDP 18,085 48.67% 7,988 21.50% 59.41% 10,097 18,085 8,067 – 909 – – 37,158 ON Thunder Bay—Superior North NDP NDP 18,334 49.92% 7,440 20.26% 59.92% 10,894 18,334 6,117 – 1,115 – 265 36,725 ON Timmins-James Bay NDP NDP 16,738 50.39% 6,212 18.70% 55.58% 10,526 16,738 5,230 – 724 – – 33,218 ON Toronto Centre Lib Lib 22,832 41.01% 6,014 10.80% 62.93% 12,604 16,818 22,832 – 2,796 108 512 55,670 ON Toronto—Danforth NDP NDP 29,235 60.80% 20,763 43.18% 65.01% 6,885 29,235 8,472 – 3,107 – 387 48,086 ON Trinity—Spadina NDP NDP 35,601 54.51% 20,325 31.12% 64.95% 10,976 35,601 15,276 – 2,861 – 596 65,310 ON Vaughan Lib Con 38,533 56.32% 18,098 26.45% 55.10% 38,533 7,940 20,435 – 1,515 – – 68,423 ON Welland NDP NDP 21,917 42.21% 1,022 1.97% 61.43% 20,895 21,917 7,276 – 1,297 169 370 51,924 ON Wellington—Halton Hills Con Con 35,132 63.70% 26,098 47.32% 66.24% 35,132 7,146 9,034 – 3,527 – 316 55,155 ON Whitby—Oshawa Con Con 37,525 58.42% 23,220 36.15% 62.53% 37,525 14,305 9,066 – 3,143 – 198 64,237 ON Willowdale Lib Con 22,207 41.70% 932 1.75% 57.23% 22,207 9,777 21,275 – – – – 53,259 ON Windsor West NDP NDP 21,592 54.33% 9,015 22.68% 48.79% 12,577 21,592 4,327 – 1,096 – 153 39,745 ON Windsor—Tecumseh NDP NDP 22,235 49.92% 7,290 16.37% 53.01% 14,945 22,235 5,764 – 1,354 – 242 44,540 ON York Centre Lib Con 20,356 48.50% 6,377 15.19% 58.98% 20,356 6,656 13,979 – 979 – – 41,970 ON York South—Weston Lib NDP 14,122 40.12% 2,580 7.33% 51.91% 8,559 14,122 11,542 – 975 – – 35,198 ON York West Lib Lib 13,030 47.00% 5,309 19.15% 48.19% 6,122 7,721 13,030 – 450 – 401 27,724 ON York—Simcoe Con Con 33,614 63.58% 23,424 44.31% 57.89% 33,614 10,190 5,702 – 2,851 – 509 52,866 PE Cardigan Lib Lib 10,486 49.63% 2,379 11.26% 77.00% 8,107 2,164 10,486 – 373 – – 21,130 PE Charlottetown Lib Lib 7,292 39.48% 1,252 6.78% 69.44% 6,040 4,632 7,292 – 417 – 87 18,468 PE Egmont Con Con 10,467 54.65% 4,470 23.34% 70.99% 10,467 2,369 5,997 – 320 – – 19,153 PE Malpeque Lib Lib 8,605 42.40% 671 3.31% 75.73% 7,934 2,970 8,605 – 785 – – 20,294 QC Abitibi—Baie-James—Nunavik—Eeyou BQ NDP 13,961 44.79% 6,872 22.05% 53.35% 7,089 13,961 3,282 5,615 1,221 – – 31,168 QC Abitibi—Témiscamingue BQ NDP 24,763 51.22% 9,505 19.66% 59.70% 4,777 24,763 2,859 15,258 694 – – 48,351 QC Ahuntsic BQ BQ 14,908 31.80% 708 1.51% 64.71% 3,770 14,200 13,087 14,908 620 – 299 46,884 QC Alfred-Pellan BQ NDP 23,098 42.09% 10,594 19.31% 65.72% 6,157 23,098 12,070 12,504 798 245 – 54,872 QC Argenteuil—Papineau—Mirabel BQ NDP 25,802 44.27% 8,922 15.31% 61.06% 6,497 25,802 7,135 16,880 1,506 342 117 58,279 QC Bas-Richelieu—Nicolet—Bécancour BQ BQ 19,046 38.30% 1,341 2.70% 65.71% 6,478 17,705 5,024 19,046 1,479 – – 49,732 QC Beauce Con Con 26,799 50.71% 10,968 20.75% 63.02% 26,799 15,831 5,833 3,535 852 – – 52,850 QC Beauharnois—Salaberry BQ NDP 23,998 43.80% 5,816 10.61% 62.12% 7,049 23,998 4,559 18,182 1,003 – – 54,791 QC Beauport—Limoilou Con NDP 24,306 46.07% 10,461 19.83% 63.17% 13,845 24,306 3,162 10,250 950 – 246 52,759 QC Berthier—Maskinongé BQ NDP 22,403 39.58% 5,735 10.13% 63.57% 7,904 22,403 8,060 16,668 1,196 – 373 56,604 QC Bourassa Lib Lib 15,550 40.91% 3,280 8.63% 55.12% 3,354 12,270 15,550 6,105 613 – 121 38,013 QC Brome—Missisquoi BQ NDP 22,407 42.64% 10,818 20.59% 66.11% 6,256 22,407 11,589 11,173 1,120 – – 52,545 QC Brossard—La Prairie Lib NDP 25,512 41.02% 8,536 13.72% 64.84% 7,806 25,512 16,976 10,890 900 – 110 62,194 QC Chambly—Borduas BQ NDP 29,591 42.74% 10,444 15.08% 70.42% 5,425 29,591 6,165 19,147 1,072 7,843 – 69,243 QC Charlesbourg—Haute-Saint-Charles Con NDP 24,131 45.01% 7,911 14.76% 66.08% 16,220 24,131 3,505 8,732 832 – 189 53,609 QC Châteauguay—Saint-Constant BQ NDP 29,156 52.04% 14,199 25.34% 65.06% 5,756 29,156 5,069 14,957 923 – 162 56,023 QC Chicoutimi—Le Fjord BQ NDP 19,430 38.13% 4,755 9.33% 63.90% 12,881 19,430 2,852 14,675 780 – 340 50,958 QC Compton—Stanstead BQ NDP 24,097 47.59% 10,918 21.56% 63.64% 5,982 24,097 6,132 13,179 1,241 – – 50,631 QC Drummond BQ NDP 24,489 51.64% 14,079 29.69% 62.50% 7,555 24,489 3,979 10,410 987 – – 47,420 QC Gaspésie—Îles-de-la-Madeleine BQ NDP 12,427 33.76% 777 2.11% 53.85% 6,292 12,427 5,533 11,650 913 – – 36,815 QC Gatineau BQ NDP 35,262 61.83% 26,643 46.72% 64.10% 4,532 35,262 7,975 8,619 639 – – 57,027 QC Haute-Gaspésie—La Mitis—Matane—Matapédia BQ BQ 12,633 36.05% 3,669 10.47% 59.66% 5,253 7,484 8,964 12,633 707 – – 35,041 QC Hochelaga BQ NDP 22,314 48.17% 7,863 16.97% 58.43% 3,126 22,314 5,064 14,451 798 – 569 46,322 QC Honoré-Mercier Lib NDP 17,545 36.37% 2,904 6.02% 59.77% 5,992 17,545 14,641 8,935 770 – 351 48,234 QC Hull—Aylmer Lib NDP 35,194 59.20% 23,143 38.93% 65.03% 6,058 35,194 12,051 5,019 1,125 – – 59,447 QC Jeanne-Le Ber BQ NDP 23,293 44.66% 10,658 20.43% 59.08% 4,678 23,293 10,054 12,635 1,377 – 121 52,158 QC Joliette BQ NDP 27,050 47.33% 8,246 14.43% 63.31% 5,525 27,050 3,545 18,804 2,227 – – 57,151 QC Jonquière—Alma Con NDP 22,900 43.44% 4,331 8.22% 65.77% 18,569 22,900 1,043 9,554 652 – – 52,718 QC La Pointe-de-l'Île BQ NDP 23,033 48.34% 7,558 15.86% 60.43% 3,664 23,033 4,369 15,475 898 – 213 47,652 QC Lac-Saint-Louis Lib Lib 18,457 34.11% 2,204 4.07% 65.90% 15,394 16,253 18,457 1,689 2,315 – – 54,108 QC LaSalle—Émard Lib NDP 17,691 42.15% 6,519 15.53% 56.92% 5,516 17,691 11,172 6,151 946 – 496 41,972 QC Laurentides—Labelle BQ NDP 24,800 43.83% 7,001 12.37% 62.25% 5,246 24,800 7,169 17,799 1,423 – 149 56,586 QC Laurier—Sainte-Marie BQ NDP 23,373 46.64% 5,382 10.74% 63.41% 1,764 23,373 4,976 17,991 1,324 73 612 50,113 QC Laval BQ NDP 22,050 43.33% 10,483 20.60% 60.59% 6,366 22,050 9,422 11,567 1,260 – 224 50,889 QC Laval—Les Îles Lib NDP 25,703 47.64% 14,595 27.05% 58.92% 8,587 25,703 11,108 7,022 966 – 563 53,949 QC Lévis—Bellechasse Con Con 25,850 43.95% 5,960 10.13% 67.10% 25,850 19,890 3,421 8,757 903 – – 58,821 QC Longueuil—Pierre-Boucher BQ NDP 27,119 51.93% 12,938 24.78% 69.21% 4,339 27,119 5,321 14,181 1,032 – 228 52,220 QC Lotbinière—Chutes-de-la-Chaudière Con Con 22,460 39.88% 777 1.38% 73.83% 22,460 21,683 2,866 8,381 936 – – 56,326 QC Louis-Hébert BQ NDP 23,373 38.65% 8,733 14.44% 66.20% 13,207 23,373 8,110 14,640 996 – 143 60,469 QC Louis-Saint-Laurent Con NDP 22,629 39.87% 1,295 2.28% 65.88% 21,334 22,629 3,612 8,148 857 – 175 56,755 QC Manicouagan BQ NDP 16,437 48.93% 5,942 17.69% 51.97% 3,878 16,437 1,882 10,495 898 – – 33,590 QC Marc-Aurèle-Fortin BQ NDP 29,107 49.68% 13,637 23.28% 67.49% 5,768 29,107 7,035 15,470 1,208 – – 58,588 QC Mégantic—L'Érable Con Con 21,931 49.14% 10,215 22.89% 61.47% 21,931 11,716 2,601 7,481 655 – 250 44,634 QC Montcalm BQ NDP 34,434 52.97% 14,825 22.80% 61.06% 5,118 34,434 3,501 19,609 2,347 – – 65,009 QC Montmagny—L'Islet—Kamouraska—Rivière-du-Loup BQ NDP 17,285 36.36% 9 0.02% 62.29% 17,276 17,285 2,743 9,550 691 – – 47,545 QC Montmorency—Charlevoix—Haute-Côte-Nord BQ NDP 17,601 37.35% 1,176 2.50% 57.35% 9,660 17,601 2,628 16,425 814 – – 47,128 QC Mount Royal Lib Lib 16,151 41.41% 2,260 5.79% 64.59% 13,891 6,963 16,151 1,136 683 74 109 39,007 QC Notre-Dame-de-Grâce—Lachine Lib NDP 17,943 39.73% 3,536 7.83% 58.51% 6,574 17,943 14,407 3,983 1,914 207 131 45,159 QC Outremont NDP NDP 21,906 56.37% 12,702 32.69% 59.70% 3,408 21,906 9,204 3,199 838 – 303 38,858 QC Papineau Lib Lib 16,429 38.41% 4,327 10.12% 61.05% 2,021 12,102 16,429 11,091 806 95 228 42,772 QC Pierrefonds—Dollard Lib NDP 16,390 34.13% 1,758 3.66% 59.15% 12,901 16,390 14,632 2,392 1,710 – – 48,025 QC Pontiac Con NDP 22,376 45.71% 7,935 16.21% 59.71% 14,441 22,376 6,242 4,917 849 – 124 48,949 QC Portneuf—Jacques-Cartier Ind NDP 22,387 42.67% 7,793 14.85% 65.87% – 22,387 3,463 10,745 1,279 14,594 – 52,468 QC Québec BQ NDP 22,393 42.64% 7,709 14.68% 66.14% 9,330 22,393 4,735 14,684 1,144 – 228 52,514 QC Repentigny BQ NDP 32,131 51.92% 12,889 20.83% 66.80% 4,606 32,131 4,830 19,242 1,078 – – 61,887 QC Richmond—Arthabaska BQ BQ 18,033 33.83% 717 1.35% 65.56% 13,145 17,316 3,711 18,033 1,098 – – 53,303 QC Rimouski-Neigette—Témiscouata—Les Basques BQ NDP 18,360 42.98% 5,190 12.15% 62.90% 6,218 18,360 4,101 13,170 867 – – 42,716 QC Rivière-des-Mille-Îles BQ NDP 25,639 49.21% 10,766 20.66% 66.60% 5,057 25,639 5,300 14,873 1,229 – – 52,098 QC Rivière-du-Nord BQ NDP 29,603 55.28% 14,498 27.07% 60.05% 4,469 29,603 3,400 15,105 972 – – 53,549 QC Roberval—Lac-Saint-Jean Con Con 18,438 45.68% 7,256 17.98% 64.20% 18,438 11,182 1,615 8,577 553 – – 40,365 QC Rosemont—La Petite-Patrie BQ NDP 27,484 51.00% 9,782 18.15% 66.47% 2,328 27,484 4,920 17,702 899 – 557 53,890 QC Saint-Bruno—Saint-Hubert BQ NDP 24,361 44.64% 8,977 16.45% 67.20% 5,887 24,361 7,423 15,384 1,523 – – 54,578 QC Saint-Hyacinthe—Bagot BQ NDP 26,963 52.36% 14,312 27.79% 66.04% 8,108 26,963 2,784 12,651 994 – – 51,500 QC Saint-Jean BQ NDP 24,943 47.48% 8,920 16.98% 62.26% 5,603 24,943 4,644 16,023 1,326 – – 52,539 QC Saint-Lambert BQ NDP 18,705 42.65% 7,352 16.76% 60.45% 4,396 18,705 8,463 11,353 944 – – 43,861 QC Saint-Laurent—Cartierville Lib Lib 17,726 43.43% 5,778 14.16% 52.18% 7,124 11,948 17,726 2,981 857 – 176 40,812 QC Saint-Léonard—Saint-Michel Lib Lib 15,340 42.30% 3,620 9.98% 51.31% 4,991 11,720 15,340 3,396 657 – 162 36,266 QC Saint-Maurice—Champlain BQ NDP 18,628 39.07% 4,667 9.79% 60.68% 8,447 18,628 5,670 13,961 972 – – 47,678 QC Shefford BQ NDP 27,575 51.09% 14,960 27.72% 64.79% 7,908 27,575 4,855 12,615 1,022 – – 53,975 QC Sherbrooke BQ NDP 22,415 43.10% 3,750 7.21% 63.41% 4,784 22,415 5,020 18,665 894 – 233 52,011 QC Terrebonne—Blainville BQ NDP 28,260 49.34% 10,597 18.50% 65.70% 5,236 28,260 4,893 17,663 1,219 – – 57,271 QC Trois-Rivières BQ NDP 26,981 53.57% 14,994 29.77% 64.45% 6,205 26,981 3,617 11,987 972 346 256 50,364 QC Vaudreuil-Soulanges BQ NDP 30,177 43.61% 12,396 17.91% 67.07% 11,360 30,177 8,023 17,781 1,864 – – 69,205 QC Verchères—Les Patriotes BQ NDP 24,514 43.31% 3,921 6.93% 71.42% 4,884 24,514 5,352 20,593 1,259 – – 56,602 QC Westmount—Ville-Marie Lib Lib 15,346 37.18% 642 1.56% 53.36% 7,218 14,704 15,346 2,278 1,516 – 213 41,275 SK Battlefords—Lloydminster Con Con 19,203 66.90% 11,436 39.84% 56.88% 19,203 7,767 950 – 785 – – 28,705 SK Blackstrap Con Con 23,280 54.40% 7,511 17.55% 69.26% 23,280 15,769 2,713 – 1,033 – – 42,795 SK Cypress Hills—Grasslands Con Con 20,555 69.85% 14,307 48.62% 66.25% 20,555 6,248 1,838 – 788 – – 29,429 SK Desnethé—Missinippi—Churchill River Con Con 10,509 47.93% 794 3.62% 50.35% 10,509 9,715 1,144 – 560 – – 21,928 SK Palliser Con Con 15,850 47.00% 766 2.27% 67.40% 15,850 15,084 1,797 – 995 – – 33,726 SK Prince Albert Con Con 19,214 62.17% 9,373 30.33% 60.00% 19,214 9,841 1,070 – 666 – 116 30,907 SK Regina—Lumsden—Lake Centre Con Con 18,076 53.21% 5,558 16.36% 66.29% 18,076 12,518 2,467 – 911 – – 33,972 SK Regina—Qu'Appelle Con Con 15,896 53.48% 4,477 15.06% 60.38% 15,896 11,419 1,400 – 879 127 – 29,721 SK Saskatoon—Humboldt Con Con 19,954 52.72% 6,683 17.66% 66.52% 19,954 13,271 3,013 – 926 682 – 37,846 SK Saskatoon—Rosetown—Biggar Con Con 14,652 48.70% 538 1.79% 60.50% 14,652 14,114 697 – 626 – – 30,089 SK Saskatoon—Wanuskewin Con Con 21,183 58.43% 9,788 27.00% 63.12% 21,183 11,395 2,428 – 1,250 – – 36,256 SK Souris—Moose Mountain Con Con 21,598 73.98% 16,137 55.28% 62.20% 21,598 5,461 1,236 – 898 – – 29,193 SK Wascana Lib Lib 15,823 40.83% 1,532 3.95% 67.21% 14,291 7,681 15,823 – 954 – – 38,749 SK Yorkton—Melville Con Con 21,906 68.93% 14,975 47.12% 62.74% 21,906 6,931 2,167 – 774 – – 31,778 Terr Nunavut Con Con 3,930 49.90% 1,670 21.21% 45.71% 3,930 1,525 2,260 – 160 – – 7,875 Terr Western Arctic NDP NDP 7,140 45.84% 2,139 13.73% 53.95% 5,001 7,140 2,872 – 477 – 87 15,577 Terr Yukon Lib Con 5,422 33.77% 132 0.82% 66.24% 5,422 2,308 5,290 – 3,037 – – 16,057
^ "Forty-First General Election 2011: Official Voting Results (raw data)". elections.ca . Retrieved July 6, 2023 . ^ including spoilt ballots ^ minor political parties receiving less than 1% of the national popular vote are aggregated under "Other"; independent candidates are aggregated separately ^ valid ballots = results as certified in a judicial recount = open seat = turnout is above national average = incumbency arose from byelection gain = incumbent switched allegiance after 2008 election = other incumbents defeated
Party summaries
Conservatives The Conservatives, who had been leading in the polls since the writs were dropped , won 166 seats - enough for the first Conservative majority government since the Progressive Conservative-Canadian Alliance merger that formed the party in 2003. Notably, the Tories made significant inroads in Toronto , taking eight seats there. While the Tories had won a few seats in the Toronto suburbs since the PC-Canadian Alliance merger, this was the first time a right-of-centre party had won seats in the former Metro Toronto itself since the PC meltdown of 1993. Combined with their traditionally heavy support in the west , this was enough to win a 14-seat majority with 39.62 percent of the national popular vote - a result also notable for being the first time the modern Conservative party successfully polled a larger share of the vote than the combined tally of the PC and CA parties in the election preceding their merger .
Despite winning a majority government, the Conservatives lost over half their seats in Quebec to the NDP, retaining only five seats in that province.
New Democrats The NDP had a major windfall , emerging as a truly national party for the first time in its 50-year history . They won 103 seats—more than double their previous high (when they won 43 seats in 1988 ). Much of this was due to a breakthrough in Quebec , a province where they had been more or less nonexistent for the better part of their history. From only one seat at dissolution , the NDP took 59 of 75 seats there, dominating Montreal and sweeping Quebec City and the Outaouais. By comparison, the NDP had only won one other seat in Quebec in its entire history prior to 2011 (and had held only one other seat, via a floor-crossing). It had not even been fully organized in the province since 1990, when its Quebec wing seceded to preach sovereigntism . The 59 seats won by the NDP in Quebec is the most won by any party in that province since the Progressive Conservatives won 63 seats there in 1988. In several cases, NDP candidates in Quebec won handily even though they didn't even actively campaign.
Among the new NDP MPs were several university students. Five members of the McGill University NDP club—Charmaine Borg , Matthew Dubé , Mylène Freeman , Laurin Liu , and Jamie Nicholls—were elected from Montreal-area ridings. Liu is the youngest woman ever elected to Parliament. Also elected was Pierre-Luc Dusseault , a freshman at the Université de Sherbrooke ; his victory in Sherbrooke, Quebec makes him the youngest MP in Canadian history (he only turned 20 two days before he was sworn in).
However, they were unable to make much of an impact in their former western heartland. They actually lost Elmwood—Transcona , the former seat of longtime MP and former deputy leader Bill Blaikie , by only 300 votes.
Liberals Winning only 34 seats, the Liberals suffered the worst result in their history . They sat as the third party in the 41st Parliament , the first since Confederation where the Liberals did not form either the Government or the Official Opposition in the House of Commons. This was the worst showing for an incumbent Official Opposition party in terms of seats, and the lowest percentage for a national Official Opposition party (the Bloc Québécois in 1997 won more seats with a smaller vote share on account of its being a regional party).
The Liberals' poor showing was largely due to a collapse of their support in Montreal and Toronto , which had been the backbones of Liberal support for almost two decades. With few exceptions, their support in Toronto flowed to the Tories, while most of their base in Montreal switched to the NDP.
In 2008, they won 20 out of the 23 ridings fully or partially within Toronto. However, in 2011, they only won six, losing 6 to the NDP and 9 to the Conservatives. Additionally, after going into the election holding 30 of the 44 seats in the Greater Toronto Area , they only won seven in 2011.
In Montreal, the Liberals lost five of their 12 seats, and came close to losing several more. Most notably, they came within 2,500 votes of losing Mount Royal, long reckoned as the safest Liberal riding in the nation.
Liberal leader Michael Ignatieff lost his seat of Etobicoke—Lakeshore to first time challenger Bernard Trottier by a margin of 5.27% of the total votes. Other famous MP's who also lost their seats are Ken Dryden (York Centre), Dan McTeague (Pickering—Scarborough East), Gerard Kennedy (Parkdale—High Park ), Ujjal Dosanjh (Vancouver South) and Joe Volpe (Eglinton—Lawrence).
All told, the Liberals only won 11 seats in Ontario (all but four in Toronto) and seven in Quebec (all in Montreal)—the fewest the party has ever won in either province. They went into the next Parliament holding only four seats west of Ontario (Winnipeg North , Wascana , Vancouver Centre and Vancouver Quadra ).
The Bloc was practically eliminated from the scene, losing 43 seats. This reduced them to a rump of four seats, only a third of the number required for official party status . In many cases, they lost seats they held since their debut performance in 1993. With few exceptions, their support bled over to the NDP. Notably, the Bloc lost all but one seat in the Montreal area. This included all of their seats in the eastern part of the city, the birthplace of the sovereigntist movement. The Bloc went into the election holding all but one seat in eastern Montreal, but lost all of them to the NDP. They also lost all or most of their seats in their longstanding strongholds in the rest of the province, such as Quebec City and central Quebec. Several Bloc MPs who had never had serious difficulty being reelected ended up losing their seats in landslides. Bloc leader Gilles Duceppe , at the time the longest-tenured party leader in Canada, lost his seat in Laurier—Sainte-Marie to NDP challenger Hélène Laverdière .
Greens Despite losing a significant share of the national vote compared to the 2008 election, Green Party leader Elizabeth May became the first Green Party member elected to the Canadian Parliament.
Vote and seat summaries [citation needed
Popular vote Conservative
39.62% NDP
30.63% Liberal
18.91% Bloc Québécois
6.04% Green
3.91% Others
0.89%
Seat totals Conservative
54.22% NDP
33.12% Liberal
11.04% Bloc Québécois
1.30% Green
0.32%
Elections to the 41st Parliament of Canada – seats won/lost by party, 2008–2011 Party 2008 Gain from (loss to) 2011 Con NDP Lib BQ Grn Ind Conservative 143 2 (6) 27 (1) 1 166 New Democratic 37 6 (2) 17 (1) 45 1 103 Liberal 77 (27) 1 (17) 34 Bloc Québécois 49 (45) 4 Green – 1 1 Independent 2 (1) (1) – Total 308 7 (30) 3 (69) 44 (1) 45 (1) 2 308
Incumbents defeated Liberal Party leader Michael Ignatieff lost his riding of Etobicoke—Lakeshore to Bernard Trottier , a Conservative ,[ 10] Bloc Québécois and incumbent in Laurier—Sainte-Marie was defeated by Hélène Laverdière of the NDP and announced his intention to resign as leader of the Bloc.[ 11]
Four Cabinet ministers, Lawrence Cannon (Foreign Affairs), Gary Lunn (Sport), Jean-Pierre Blackburn (Veterans Affairs and Agriculture), and Josée Verner (Intergovernmental Affairs and Francophonie) lost their seats. Lunn lost to Green Party leader Elizabeth May , and the NDP won the other three seats.[ 12]
Defeated incumbents and winners by province
Open seats The Bloc gained Haute-Gaspésie—La Mitis—Matane—Matapédia by the largest margin of victory of their four seats won and vacated by a long-standing member of the Bloc Québécois.
The Conservatives gained Calgary Centre-North and Prince George—Peace River , both vacated by long-standing Conservatives.
Seats that changed hands through vacancies at dissolution or retirements Prince Edward Island Outgoing incumbent Affiliation Winner Affiliation Electoral district Shawn Murphy Liberal Sean Casey Liberal Charlottetown
Results by province Party name BC AB SK MB ON QC NB NS PE NL YT NT NU Total Conservative Seats: 21 27 13 11 73 5 8 4 1 1 1 0 1 166 Vote: 45.5 66.8 56.3 53.5 44.4 16.5 43.9 36.7 41.2 28.4 33.8 32.1 49.9 39.6 New Democrats Seats: 12 1 0 2 22 59 1 3 0 2 0 1 0 103 Vote: 32.5 16.8 32.3 25.8 25.6 42.9 29.8 30.3 15.4 32.6 14.4 45.8 19.4 30.6 Liberal Seats: 2 0 1 1 11 7 1 4 3 4 0 0 0 34 Vote: 13.4 9.3 8.6 16.6 25.3 14.2 22.6 28.9 41.0 37.9 33.0 18.4 28.7 18.9 Bloc Québécois Seats: 4 4 Vote: 23.4 6.0 Green Seats: 1 0 0 0 0 0 0 0 0 0 0 0 0 1 Vote: 7.7 5.3 2.7 3.6 3.8 2.1 3.2 4.0 2.4 0.9 18.9 3.1 2.0 3.9 Independent and no affiliation Vote: 0.2 1.3 0.2 0.1 0.2 0.6 0.5 0.3 0.4 Total seats 36 28 14 14 106 75 10 11 4 7 1 1 1 308
British Columbia
Prairie provinces
Alberta
Saskatchewan Results in Saskatchewan Party Seats Second Third Fourth Fifth Votes % +/- Conservative 13 1 0 0 0 - Liberal 1 0 13 0 0 - New Democrats 0 13 1 0 0 Green 0 0 0 14 0 Canadian Action 0 0 0 0 1 Independent 0 0 0 0 2 Total 14 100.0
Manitoba Results in Manitoba Party Seats Second Third Fourth Fifth Sixth Votes % +/- Conservative 11 2 1 0 0 0 +2 New Democrats 2 9 3 0 0 0 -2 Liberal 1 3 9 1 0 0 - Green 0 0 1 13 0 0 Christian Heritage 0 0 0 0 2 0 Independent 0 0 0 0 2 2 Communist 0 0 0 0 2 0 Pirate 0 0 0 0 0 1 Total 14 100.0
Ontario
Quebec
Atlantic provinces
New Brunswick Results in New Brunswick Party Seats Second Third Fourth Fifth Votes % +/- Conservative 8 2 0 0 0 +2 Liberal 1 2 7 0 0 -2 New Democrats 1 6 3 0 0 - Green 0 0 0 8 1 Marxist–Leninist Christian Heritage 0 0 0 0 1 Total 10 100.0
Nova Scotia Results in Nova Scotia Party Seats Second Third Fourth Fifth Votes % +/- Conservative 4 5 2 0 0 +1 Liberal 4 3 4 0 0 -1 New Democrats 3 3 5 0 0 +1 Green 0 0 0 11 0 Christian Heritage 0 0 0 0 1 Marxist–Leninist 0 0 0 0 1 Total 11 100.0
Prince Edward Island
Newfoundland and Labrador Results in Newfoundland and Labrador (Preliminary) Party Seats Second Third Fourth Votes % +/- Liberal 4 2 1 0 -2 New Democrats 2 0 5 0 +1 Conservative 1 5 1 0 +1 Green 0 0 0 5 Independent 0 0 0 2 Total 7 100.0
Results by territory Results in the Yukon Party Seats Second Third Votes % +/- Conservative 1 5,422 33.8 +1.1 Liberal 1 5,290 32.9 -12.9 Green 1 3,037 18.9 +6.1 New Democrats 2,308 14.4 +5.7 Total 1 16,057 100.0
Results in the Northwest Territories Party Seats Second Third Fourth Votes % +/- New Democrats 1 7,140 45.8 +4.3 Conservative 1 5,001 32.1 -5.5 Liberal 1 2,872 18.4 +4.8 Green 1 477 3.1 -2.4 Animal Alliance 87 0.6 +0.6 Total 1 15,577 100.0
Results in Nunavut Party Seats Second Third Votes % +/- Conservative 1 3,930 49.9 +15.0 Liberal 1 2,260 28.7 -0.4 New Democrats 1 1,525 19.4 -8.2 Green 160 2.0 -6.3 Total 1 7,875 100.0
See also
References ^ a b "PM returns to Ottawa after majority win". Canadian Broadcasting Corporation . May 3, 2011. Retrieved May 3, 2011 . ^ Maher, Stephen (May 3, 2011). "Harper delivers Conservatives' first majority since 1988". Halifax Chronicle-Herald . Archived from the original on May 6, 2011. Retrieved May 3, 2011 . ^ Cheadle, Bruce (May 3, 2011). "Harper finally wins Conservative majority, NDP makes huge gain". 660news.com. Archived from the original on September 28, 2011. Retrieved May 3, 2011 . ^ Clark, Campbell (May 3, 2011). "Layton gears up for new gig as prime minister in waiting". Globe and Mail . Toronto. Retrieved May 3, 2011 . ^ Young, Leslie (May 3, 2011). "NDP wins record number of seats". Global TV Toronto. Archived from the original on July 23, 2011. Retrieved May 3, 2011 . ^ a b Taber, Jane (May 3, 2011). "Ignatieff resigns after Liberal defeat". Globe and Mail . Toronto. Retrieved May 3, 2011 . ^ De Souza, Mike (May 3, 2011). "Liberal insiders say party must take long look in mirror". Canada.com . Retrieved May 3, 2011 . ^ Hartnett, Cindy (May 3, 2011). "May breaks through as first Green MP". Montreal Gazette . Retrieved May 3, 2011 . ^ Leblanc, Daniel (May 2, 2011). "Duceppe resigns as Bloc leader after losing riding". Globe and Mail . Toronto. Retrieved May 3, 2011 . ^ "Ignatieff's Liberals lose Official Opposition stats". CBC News . May 2, 2011. Retrieved May 3, 2011 . ^ "Duceppe quits after BQ crushed in Quebec". CBC News . May 2, 2011. Retrieved May 3, 2011 . ^ "Major players fall like bowling pins before Tory, NDP surges". Canadian Press. May 3, 2011. Retrieved May 3, 2011 . [dead link Animal Alliance (Liz White, candidates )Bloc Québécois (Gilles Duceppe , candidates )Christian Heritage (James Hnatiuk , candidates )Communist (Miguel Figueroa , candidates )Conservative (Stephen Harper , candidates )Green (Elizabeth May , candidates )Independent candidates Liberal (Michael Ignatieff , candidates )Libertarian (Dennis Young, candidates )Marxist–Leninist (Anna Di Carlo, candidates) New Democrats (Jack Layton , candidates )Rhinoceros (François Gourd , candidates )Bold indicates parties with members elected to the House of Commons .