2002 United States House of Representatives elections in Maryland ← 2000 November 5, 2002 (2002-11-05 ) 2004 →
United States House of Representatives Majority party Minority party Party Democratic Republican Seats won 6 2 Seat change Popular vote 904,250 752,911 Percentage 54.50% 45.38% Swing
Democratic
50–60%
60–70%
70–80%
Republican
60–70%
70–80%
Elections in Maryland County executive elections County offices
The Maryland Congressional elections of 2002United States House of Representatives expired on January 3, 2003, and therefore all were put up for contest. The winning candidates served a two-year term from January 3, 2003, to January 3, 2005.
Overview United States House of Representatives elections in Maryland, 2002[1] Party Votes Percentage +/– Seats +/– Democratic 904,250 54.50% -0.56% 6 +2 Republican 752,911 45.38% +0.94% 2 -2 Green 158 0.01% - 0 — Others 1,794 0.11% - 0 — Totals 1,659,113 100.00% - 8 —
District 1 Marylands's 1st congressional district election, 2002 Party Candidate Votes % Republican Wayne Gilchrest (inc. ) 192,004 76.83 Democratic Amy D. Tamlyn 57,986 23.20 Total votes 249,900 100.00 Republican hold
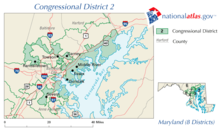
District 2 Marylands's 2nd congressional district election, 2002 Party Candidate Votes % Democratic Dutch Ruppersberger 105,718 54.31 Republican Helen Delich Bentley 88,954 45.69 Total votes 194,672 100.00 Democratic gain from Republican
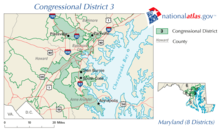
District 3 Marylands's 3rd congressional district election, 2002 Party Candidate Votes % Democratic Benjamin Cardin (inc. ) 145,589 65.79 Republican Scott Conwell 75,721 34.21 Total votes 221,310 100.00 Democratic hold
District 4 Marylands's 4th congressional district election, 2002 Party Candidate Votes % Democratic Al Wynn (inc. ) 131,644 78.96 Republican John B. Kimble 34,890 20.93 Write-ins 195 0.12 Total votes 166,729 100.00 Democratic hold
District 5 Marylands's 5th congressional district election, 2002 Party Candidate Votes % Democratic Steny Hoyer (inc. ) 137,903 69.36 Republican Joseph T. Crawford 60,758 30.56 Green Bob S. Auerbach (write-in) 158 0.08 Total votes 198,819 100.00 Democratic hold
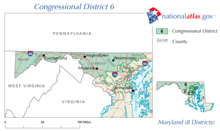
District 6 Marylands's 6th congressional district election, 2002 Party Candidate Votes % Republican Roscoe Bartlett (inc. ) 147,825 66.17 Democratic Donald M. DeArmon 75,575 33.83 Total votes 223,400 100.00 Republican hold
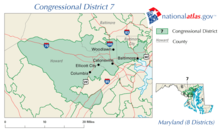
District 7 Marylands's 7th congressional district election, 2002 Party Candidate Votes % Democratic Elijah Cummings (inc. ) 137,047 73.59 Republican Joseph E. Ward 49,172 26.41 Total votes 186,219 100.00 Democratic hold
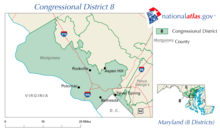
District 8 Marylands's 8th congressional district election, 2002 Party Candidate Votes % Democratic Chris Van Hollen 112,788 51.74 Republican Connie Morella (inc. ) 103,587 47.52 Write-ins 1,599 0.73 Total votes 217,974 100.00 Democratic gain from Republican
List of Connie Morella endorsements
References See also
Senators Representatives (ordered by district)
General 1946 1948 1950 1952 1954 1956 1958 1960 1962 1964 1966 1968 1970 1972 1974 1976 1978 1982 1986 1988 1990 1992 1994 1996 1998 2000 2002 2004 2006 2008 2010 2012 2014 2016 2018 2020 2022 2024 Governor State Senate House of Delegates U.S. President U.S. Senate U.S. House Attorney General Comptroller County Executive County offices
U.S. U.S. Governors State Attorneys General State Mayors Anaheim, CA Dallas, TX (special) Irvine, CA Long Beach, CA New Orleans, LA Oakland, CA Providence, RI San Jose, CA Tulsa, OK Washington, DC States Alabama Alaska Arizona Arkansas California Colorado Connecticut Delaware Florida Georgia Hawaii Idaho Illinois Indiana Iowa Kansas Kentucky Louisiana Maine Maryland Massachusetts Michigan Minnesota Mississippi Missouri Montana Nebraska Nevada New Hampshire New Jersey New Mexico New York North Carolina North Dakota Ohio Oklahoma Oregon Pennsylvania Rhode Island South Carolina South Dakota Tennessee Texas Utah Vermont Virginia Washington West Virginia Wisconsin Wyoming